Settings for thickness uncertainty ('seismic' intervals)
With the Thickness (Seismic) form (model > 3D Structure > Thickness (Seismic)) you parameterize uncertainty for 'seismic' intervals which are set to 'uncertain' on the Define Uncertainty form. This means that, per uncertain interval, you specify a variogram in case of method SGS or a probability density function (PDF) in case of Multiplier method.
Subsequently you specify, per interval, the envisioned growth/shrinkage as a percentage of the interval thickness. The percentage you enter represents one standard deviation of the envisioned growth/shrinkage. As there are various other controls on the form, some of which might need preparation or consideration beforehand, it is recommended to read the following paragraphs with 'background information' before you start working with the form.
When running a volumetric study with the study strip, per realization a depth shift map (growth/shrinkage is converted to depth) is created. This depth shift map represents (for that particular realization) the results, per uncertain interval, of the combined (hierarchically handled) stochastic inputs of the Depth and Seismic/Sub-Seismic Thickness input forms.
With the Preview ![]() button on the form you can generate and visualize one (random) shift map, which is based only on the settings on the 'Thickness (Seismic)' form. The purpose of generating and previewing such a shift map is to QC the settings you entered on the form (i.e. variogram for SGS or PDF for Multiplier, and standard deviation of the growth factor) and adapt these settings if necessary.
button on the form you can generate and visualize one (random) shift map, which is based only on the settings on the 'Thickness (Seismic)' form. The purpose of generating and previewing such a shift map is to QC the settings you entered on the form (i.e. variogram for SGS or PDF for Multiplier, and standard deviation of the growth factor) and adapt these settings if necessary.
Once generated with the Preview button on the form, you can find this shift map (called ‘Preview Shift Map’, a 2D grid) in the Data > Maps > Depth and Thickness Uncertainty folder, with property 'Depth' representing growth (or, if negative, 'shrinkage') as a factor of the original interval thickness. Shift maps of fixed intervals (i.e. intervals with a closed lock  on the Define Uncertainty form) cannot be previewed, as 'growth' as a factor of interval thickness would be zero. Preview maps of the bounding surfaces of fixed intervals can be previewed tough with the QC Uncertainty form, showing the shift property in depth.
You can only have one preview map per solution, hence applying a preview again, or with any of the other workflow forms that have a preview option (i.e. the 'Depth', 'Thickness (Sub-Seismic)' and 'QC Uncertainty' forms) will overwrite any existing shift map. Duplicate (or rename) a preview shift map if you want to retain it.
Shift maps that are generated with the Preview button on the form are not used in any way in the volumetric study. You can optionally remove these maps after you have finalized QC-ing your settings.
Amplitude of shift, i.e. the amount you think an interval can grow or shrink due to its uncertainty, needs to be specified for each individual uncertain interval. The value(s) you provide on the form under Global standard deviation and Local standard deviation represent the amount of growth at one standard deviation (1 sigma) of the gaussian normal distribution sampled by SGS. Since in a normal gaussian distribution 68.3% of the values lie within one standard deviation of the mean, this means that 68.3% of realizations will lead to less growth/shrinkage than the value(s) you provide on the form, and 31.7% of realizations will lead to more growth/shrinkage than the value(s) you provide on the form.
You can apply a laterally uniform uncertainty for the entire model area (select 'Global') or you can provide a locally varying uncertainty in the form of a prepared/imported map (select 'Local'). In other words, with a 'Local standard deviation map' you can differentiate between areas with low and high uncertainty.
For example: when using 'Global standard deviation' with a value of 0.2, at all locations of the SGS map where 1 sigma is sampled, this will result in 20% growth of the interval (relative to the original interval thickness at that location). When you provide a 'Local standard deviation' map with values of 0.05, 0.1 and 0.2, at all locations where SGS samples 1 sigma, this will result in 5%, 10% and 20% growth respectively (relative to the original interval thickness at that location). For the requirements of a Local standard deviation map, see 'Local standard deviation' below.
To define thickness uncertainty
Structural Model At the top of the form, select the Structural Model for which you want to make seismic intervals uncertain.
In the Uncertain Intervals table at the left side of the form, select an interval.
Depending on your choice of method, continue reading under 'Define variogram(s) for SGS' or 'Define PDF(s) for Multiplier method':
Variogram type Choose a variogram type to control how the variogram model is auto-fitted to the data:
- Exponential
- Gaussian
- Spherical
Major range Specify the distance at which the values become independent (the variogram reaches its plateau). The distance is measured in the direction with the greatest spatial continuity.
Minor range Specify the distance at which the values become independent (the variogram reaches its plateau). The distance is measured in the direction with the least spatial continuity (by definition perpendicular to the major direction).
Azimuth (GN) Enter the azimuth (angle with Northing direction) of the axis corresponding with the major range.
Seed (only for creating a preview map) The seed is only used to generate the preview map with the Preview ![]() button on the form. This seed is not used during the Study run. Click on the dice to generate a random seed number for the SGS preview map.
button on the form. This seed is not used during the Study run. Click on the dice to generate a random seed number for the SGS preview map.
Optional - Click the uncertainty symbol  behind the seed to open a basic Uncertainty Parameter dialog, which displays:
- Name - name of the uncertainty parameter on the 'Designs' form in the study strip. Although not recommended, you can edit the name.
- The reference value is not editable and displays the seed value of the main form.
When you have finished entering the variogram settings, continue with 'Setting the standard deviation' further below.
Multiplier distribution settings Click on the uncertainty symbol to open the Uncertainty Parameter dialog where you can define the probability density function (PDF) for the multiplier value. This PDF will be sampled for each realization during the study run to obtain a multiplier value. This multiplier value will be multiplied with the amplitude you entered in the Global or Local standard deviation entry field on the form, to get the final depth shift for that realization.
For example:
- Multiplier value = 0.2. Global standard deviation = 50%. Growth = 0.2 * 50% = 10% (*). This means the interval thickness for this realization will grow with 10%.
- Multiplier value = -0.4. Global standard deviation = 50%. Growth = -0.4 * 50% = -20% (*). This means the interval thickness for this realization will grow with -20% (i.e. the interval will shrink).
(*) Both examples assume that the standard deviation on the Uncertainty Parameter dialog is kept at its default value of 1, see red box in image below.
When you have defined the PDF, you can use the dice ![]() to randomly sample a multiplier value from the PDF (the sampled value is auto-filled in the entry field in front of the uncertainty symbol ). The value is used to generate the preview map with the Preview
to randomly sample a multiplier value from the PDF (the sampled value is auto-filled in the entry field in front of the uncertainty symbol ). The value is used to generate the preview map with the Preview ![]() button on the form (see 'Preview' below).
button on the form (see 'Preview' below).
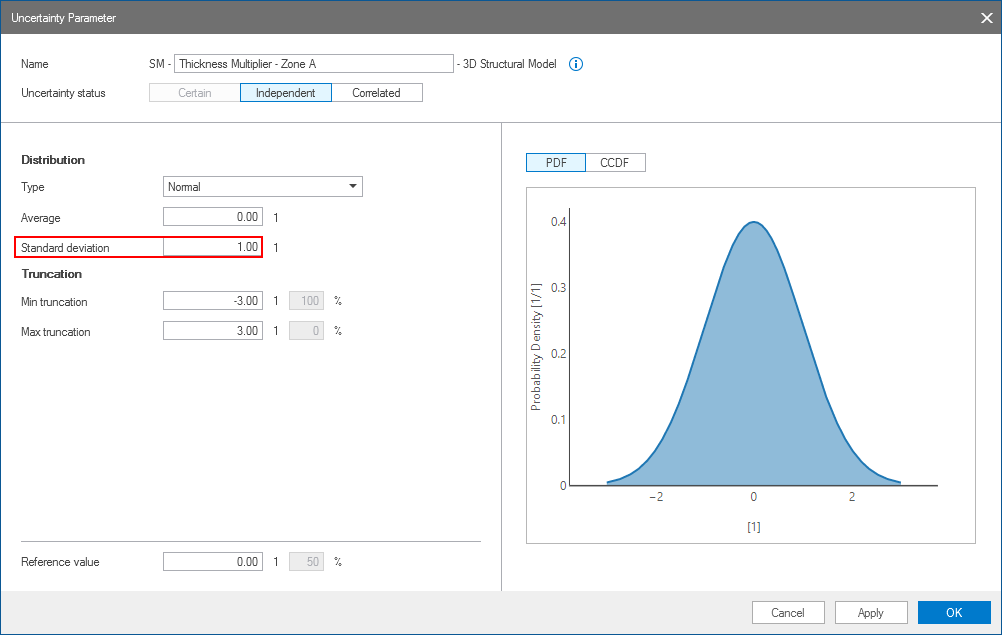
The Uncertainty Parameter dialog. For your own perception it is recommended to keep the standard deviation for Multiplier value at '1' so that when one standard deviation is sampled from the PDF, this results in the amount of growth that you entered for one Global/Local standard deviation on the Thickness (Seismic) form. click to enlarge
For a description of the controls of the Uncertainty Parameter dialog, see The Uncertainty Parameter dialog. Here follow some special remarks when this dialog is used in the Depth and Thickness Uncertainty workflow:
- As multiplier values are unit-less this means that the values you enter in the entry boxes on the Uncertainty Parameter dialog are unit-less as well. The amount of shift (in m. or ft.) is the multiplier value (as sampled from the PDF) times the Global/Local standard deviation (as entered on the 'Thickness (Seismic)' form) times the standard deviation value in the Uncertainty Parameter dialog (red box in image, default set to 1). It is strongly recommended, for your own perception, to keep this value '1' so that one standard deviation in the PDF equals the amount of growth that you entered for one standard deviation in the Global/Local standard deviation entry field on the 'Thickness (Seismic)' form.
- The log-normal distribution (located under 'Distribution') is not available for depth and thickness uncertainty.
- The 'Reference value' has no meaning in the Depth and Thickness Uncertainty workflow. It is the same value as the one located in front of the uncertainty symbol on the form, and only used to generate the Preview map.
on the 'Thickness (Seismic)' form.Entering growth per standard deviation
For background information, see Global or local standard deviation - background information above.
Select an interval in the Uncertain Intervals table at the left side of the form. As a next step, you will define the amplitude of shift as a percentage (or factor) of the original interval thickness (e.g. 20%, or 0.2). This value represents the amount of growth at one standard deviation of the gaussian normal distribution sampled by SGS (when set at 20%, then +1 sigma is 20% growth, -1 sigma is 20% shrinkage).
You can define the amplitude of shift in two ways:
- Global standard deviation Select this option if you want the same level of uncertainty across the model area. This means that over the entire model area, similar SGS sampling will result in similar amount of growth/shrinkage (relative to the original interval thickness at that location). Enter the growth value, representing growth at 1 sigma, in the entry field on the form.
- Local standard deviation Select this option if you want uncertainty to vary across the model area. This situation often results from lateral variations in the data quality, seismic velocity uncertainty and seismic interpretation quality. With 'local standard deviation' you can define areas with more or less interval growth at similar SGS sampling. To be able to use the 'Local standard deviation' option, you need to provide a 'local standard deviation' map. The values on the map should represent the growth (relative to original interval thickness at that location, and provided as a factor) at 1 sigma SGS sampling. You can select this map from the drop-down boxes on the form. The map has the following requirements:
- The map has to be in either the Imports folder or the Data folder in the JewelExplorer.
- The map has to be a 2D grid.
- Type = Map.
- The map needs to have a property of the property type = 'Dimensionless Quantity' (see Workspace > Property Inspector
 ).
). - The lateral extent of your local standard deviation map needs to be equal or greater than your structural model extent.
You can analytically create such map (with Property Calculator or the Editing Tools > Property Tools) or derive it from supporting data such as seismic attributes.
(Optional) Click Preview ![]() to preview the shift map of the interval selected in the 'Uncertain Intervals' table on the form (for background information, see Previewing depth shift maps - background information above.)
to preview the shift map of the interval selected in the 'Uncertain Intervals' table on the form (for background information, see Previewing depth shift maps - background information above.)
Upon clicking:
- A map called 'Preview Shift Map' (a 2D grid) is added to the Data > Maps > Depth and Thickness Uncertainty folder in the JewelExplorer, with the property 'Depth' representing the amount of growth/shrinkage as factor of the original interval thickness.
- The shift map is automatically shown in the 3D View (you can also visualize it in a 2D View (Workspace > 2D View).
Apart from the 'Depth' property, the shift map also contains the following properties:
- Property 'Thickness uncertainty method values' - For method SGS, this is the normalized depth shift map generated by SGS, and before multiplication with your global or local standard deviation (the property is unit-less with standard deviation = 1 and mean = 0). For Multiplier method, this is the sampled multiplier value (the property is unit-less with standard deviation as specified on the Uncertainty Parameter dialog, see image above).
- Property 'Depth standard deviation' - This is the standard deviation map, displaying either the global standard deviation value or the local standard deviation map as provided by you. This property is in SI units.
Repeat the above steps for all the intervals in the Uncertain Intervals table at the left side of the form.
When you have completed the settings on the form, click Apply or OK at the base of the form. On the Designs form of the Volumetrics Study workflow of the study strip, the uncertainty parameters will appear with the following name convention:
- Thickness Multiplier - <name of the surface> - <name of the structural model>
- Thickness SGS Seed - <name of the surface> - <name of the structural model>
When running a volumetric study, the multiplier value or seed are resampled for each realization.